INTRODUCTION
DMFit web edition is a web-based application to fit bacterial curves where a linear phase is preceded and followed by a stationary phase. The web-edition of DMFit was developed with funding from the UK Food Standards Agency.
This edition of DMFit allows the user to:
- View a graphical representation of microbiological growth/survival data
- Fit a growth/survival model to the data to obtain parameter estimates for
- Maximum growth/death rate
- Lag time (or shoulder)
- Initial cell count
- Final cell count
- Estimate standard errors on these parameters
LOADING DATA
Time vs. log counts (or ln counts) should be loaded into the data points table, on the left side of the screen. The dataset can be typed directly or copied from another application (e.g. Excel spreadsheet, textfile) and pasted.
When bacterial concentrations are lower than the detection threshold, '-0.01' can be used as a code for 'Not Detected'. Although displayed on the graph, this point will not used in the fitting.
MODELS
Bacterial curves can be fitted to two different types of models (or partial forms of these models):
- The model of Baranyi and Roberts
- The trilinear model, biphasic models and linear models
a) Model of Baranyi and Roberts
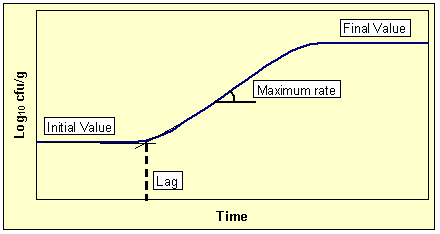
The model of Baranyi and Roberts (1994) describes a sigmoid bacterial curve. The main difference between this model and other sigmoid curves like Gompertz, Logistic, etc. is that the mid-phase is close to linear unlike those classical sigmoid curves which have a pronounced curvature there. The model of Baranyi and Roberts has 4 main parameters (Initial Value, lag/shoulder, maximum rate, Final Value) and 2 curvature parameters: mCurv and nCurv which describe the curvature of the sigmoid curve respectively at the beginning and at the end of the growth phase. In the desktop version of DMFit, these parameters, although not optimised, may be omitted, one or both of them, by the program if parsimony requires so. In this version, The values of mCurv and nCurv depend on the model selected by the user:
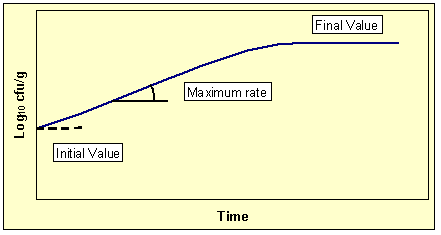
When selecting 'model of Baranyi and Roberts- no lag', the curvature parameter mCurv is set to zero, i.e the model describes only the growth/death and the stationary phase.
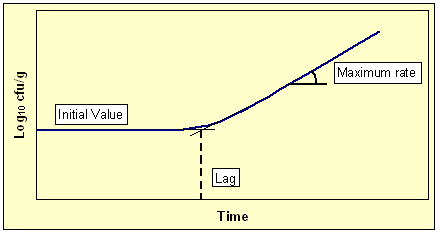
When selecting 'model of Baranyi and Roberts- no asymtot', the parameter nCurv is set to zero. Consequently, the model describes only the lag/shoulder phase and the growth/death phase.
When 'model of Baranyi and Roberts- complete model' is selected, default values are used for mCurv and nCurv:
- mCurv=10
- nCurv=1
b) Trilinear, biphasic or linear models
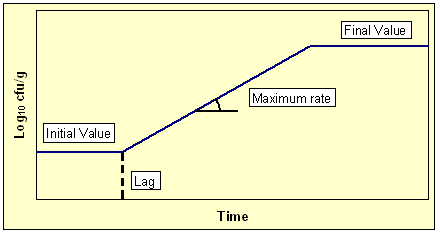
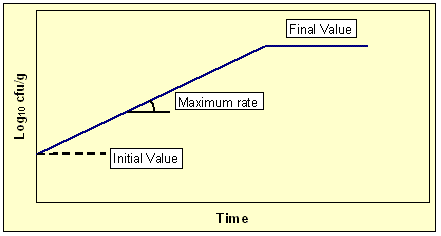
As its name suggests the trilinear model describes a bacterial growth curve with three straight lines: the lag phase and the stationary phase are described by two horizontal straight lines. The slope of the third straight line describing the growth/death phase is called the 'maximum rate'.
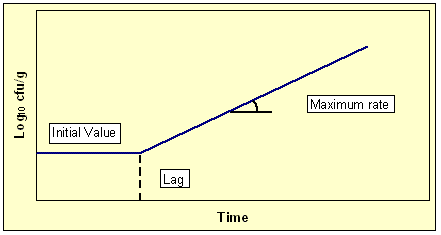
When the bacterial curve exhibits no lag/shoulder or no stationary phase, biphasic models (with no lag or no stationary phase) should be preferred to the trilinear model.
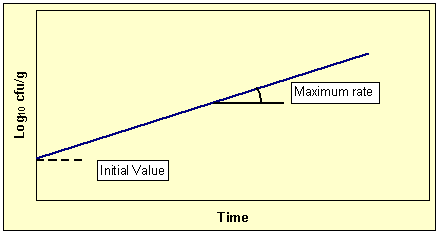
When the bacterial counts describe only the growth/death phase, the data can be fitted to a linear model.
FITTING MODELS
Having loaded data into the data table, the points will be fitted according to the models displayed in the results panel combobox. When the linear model is selected, regression coefficients are calculated with a linear regression subroutine. For any other model, an initial estimate of the growth parameters and then use this as a starting point for estimating the parameters by a non linear least square method. If the fitting algorithm does not converge to a solution, the points will not be fitted.
When the program finds estimates for the parameters, the estimated parameters and their standard errors are shown in the 'Results' panel along with goodness of fit data:
'R-square' textbox: adjusted R-square
'SE of Fit' textbox: standard error of fit
UNITS
The units of the estimates relate to the units of the data in the data points table. For example, if the bacterial counts are in log10 cfu/g and the Time in hours, the maximum growth/death rate will be in log10 cfu/g/h. If the counts are in ln cfu/g and the Time in hours, the maximum rate will be in ln cfu/g/h (the rate expressed in this unit is also called 'specific maximum rate').
In a similar way, if the Time is in hours, the lag/shoulder will be in hours. The estimates for the Initial Value and the Final Value are also in the same units as the data (typically log10 cfu/g or ln cfu/g).
REFERENCES
Baranyi J. and Roberts T.A. (1994). A dynamic approach to predicting bacterial growth in food. Int. J. Food Microbiol. 23, 277-294.
The data set should be inserted in the format illustrated and described below:
| 0.00 |
2.640 |
| 12.89 |
4.320 |
| 14.92 |
4.690 |
| 17.90 |
5.550 |
| 19.94 |
5.550 |
| 22.99 |
6.240 |
| 25.86 |
6.830 |
| 27.90 |
7.400 |
| 29.94 |
7.930 |
| 31.97 |
8.210 |
| 32.98 |
8.370 |
| 34.00 |
8.450 |
| 35.01 |
8.470 |
| 38.92 |
8.770 |
| 45.97 |
9.150 |
| 48.00 |
8.890 |
| 54.95 |
9.050 |
For each time log count record of your
dataset, time is to be entered first then log count.
You must use the 'point' symbol "." as the decimal separator.
Note that '-0.01' should be used only as a code for N/D (not detected), see below.
Measurements under Detection Threshold
When the concentration of the microorganism is lower than the detection threshold, '-0.01' should be used as a code for N/D ('Not Detected'). Note that '-0.01' is used only as a code and although these data are displayed on the graph, they are not used in the fitting.
Other requirements
- The bacterial counts must be entered as log counts, either log10 cfu/ml or ln cfu/ml (or log10 cfu/g or ln cfu/g).
- The data can be typed directly be copied from another application (e.g. Excel spreadsheet, text file) and pasted directly into the data table.
- There must be a minimum of 2 and a maximum of 100 (log counts vs time) records in your data set.
MODELS AVAILABLE AND SIGNIFICANCE OF THE PARAMETERS
A description of the parameters defining the models available in DMFit is provided below:
Initial Value: the initial logarithm of the bacterial cell density (in log10 cfu/g or ln cfu/g).
Lag/shoulder: lag time (or shoulder in case of a survival curve). The lag time is usually defined as the intersection between the tangent to the exponential growth phase and the Initial Value. The units are the same as the units used for the time data.
Maximum rate: Maximum growth rate (or maximum death rate in case of a survival curve). The units of the estimates relate to the units of the data. For example, if the bacterial counts are in log10 cfu/g and the Time in hours, the maximum growth/death rate will be in log10 cfu/g/h.
Final value: the final logarithm of the cell density, in the same units as the data.
MODELS
This section proposes a simple graphical representation of the models available and their parameters.
1.- MODEL OF BARANYI AND ROBERTS
Model of Baranyi and Roberts (1994)- complete model
Model of Baranyi and Roberts (1994)- no lag
Model of Baranyi and Roberts (1994)- no asymtot
2.- TRILINEAR, BIPHASIC OR LINEAR MODELS
Trilinear model
Biphasic model (no lag)
Biphasic model (no asymtote)
Linear model
REFERENCES
Baranyi J. and Roberts T.A. (1994). A dynamic approach to predicting bacterial growth in food. Int. J. Food Microbiol. 23, 277-294.