Q: What is the difference between ComBase Browser and the ComBase models?
A: The ComBase Browser searches a database of kinetics of spoilage organisms and pathogens in broth and food. The data come from the scientific literature or were produced by miscellaneous institutions. The ComBase models give predictions from models based on selected data of the ComBase database as a function of environmental factors such as temperature, pH and water activity in broth.
Q: What are the ComBase predictive models?
A: The ComBase Predictive Models consist on a set of free on-line applications for predicting the growth or inactivation of the organisms. Currently available models include:
- ComBase models, a set of models for predicting the response of a range of pathogens and spoilage microorganisms to key factors.
- Perfringens Predictor, an application for predicting the growth of Clostridium perfringens during the cooling of meats.
- Salmonella in egg, a model for predicting the growth of antibiotic resistant salmonella (Typhimurium DT104) in liquid egg products between 10°C and 42°C.
Q: Are there any costs associated with registration?
A: There is no cost associated with registering.
Q: Why should I register?
A: We collect registration data for two main purposes: to gain information about the customer base, e.g. which part of the world or which industry or legislative agency are accessing the data; and also so that we can target users with new information, e.g. updates and improvements to ComBase. We do not disclose submitted details to third parties.
Q: Are there any publications available on the topic?
A: A list of relevant publications can be viewed in the Publications section of combase.errc.ars.usda.gov
.
Q: Is it possible to download graphs from ComBase?
A: If you print the screen from the web browser directly, the result is not well scaled. However, there is a print icon that generates an HTML page that is more suitable for printing. Users can print this either as pdf or on a paper printer. The “print” icon is available for the ComBase broth models and Perfringens Predictor.
Q: Is it possible to include a screenshot of ComBase predictions on teaching powerpoint slides?
A: You are welcome to use any ComBase related figures or data. Our general policy is that ComBase is totally open and free as long as the resource is used for training or research.
Q: As a scientist interested in food safety, I am keen on the results of our research to reach a wide audience. Would it be possible for data that we have generated to be included in the ComBase database?
A: The success of ComBase relies on continuously adding new data. Therefore, we are pleased to help you submit data. Instructions, templates and videos are on the Donate Data page .
Q: What mechanism ensures that ComBase does not include poor quality or erroneous data?
A: The ComBase Partners conduct Quality Assurance on submitted data, with a final review done before data are finally published in ComBase. If data have been published in a peer-reviewed journal, those data will be included in ComBase unchanged (except for very obvious mistakes). Therefore ComBase is not different from other electronic publications. Interpretation of the data will be highly individual and the ComBase team assumes no responsibility for how the data are used. We recommend that expert advice should be sought where necessary.
Q: I have tried to use ComBase, however it seems that little information is available for spoilage organisms in real food.
A: Indeed, most of the data are on responses of pathogens observed in laboratory media. The main reason for this is that the vast majority of the data underlying ComBase are from the PMP (Pathogen Modeling Program) and FMM (Food MicroModel) databases and both these databases were primarily aimed at recognised foodborne pathogens. However, data are constantly being added to ComBase including microbial response records for food spoilage organisms. The database is periodically updated and will eventually reflect these new additions. Existing customer data can be converted into models are part of our bespoke modelling services. For more information contact info@ifrextra.co.uk
Q: If no records are found for a query, does that mean that bacteria will not grow in the given conditions?
A: No record found means that no record exists within the database for that particular set of conditions. No conclusion can be drawn from this regarding the bacterial response to the environmental factors in question. Data can be generated and modelled as part of our bespoke modelling packages.
Q: I get different maximum rates for the same values of temperature, pH and water activity in the ComBase database. Which is the correct one?
A: The growth rate not only depends on the temperature, pH and water activity but also on other environmental factors that are not necessarily recorded. In addition the nature of the food can have a big influence on the rate.
Q: What are the ComBase broth models?
A: The ComBase broth mothels are a set of predictive models, including growth and thermal death models. Models can be used for predicting the response of a range of pathogens and spoilage microorganisms to key environmental factors (temperature, pH and salt concentration).Some models also include an additional, fourth environmental factor, such as the concentration of carbon dioxide or acetic acid.
Q: What does maximum rate [ log10 (cfu/h) ] mean exactly?
A: Classical predictive microbiology is based on the assumption that the rate of growth/death of a given micro-organism in the exponential phase is characteristic of its environment. The maximum rate is the maximum slope of the “log(cell-conc.) versus time” curve, in a given environment. The most important environmental parameters are temperature, pH and water activity (a quantification of water available to the cells). Other factors such as the concentration of additives, preservatives, etc. may also influence the growth rate.
Q: What does the D-Value mean?
A: The D-value is the time in defined conditions necessary to obtain a decimal reduction of the microorganisms being studied (i.e. to kill 90% of the organisms). It is deduced from the death rate by the formula:
D=1/death rate
Q: What is the difference between predicting the lag time and the growth rate?
A: Although modelling the lag time is very important, to date predictive modelling has primarily concentrated on growth rates. This is because lag is more difficult to model as it depends not only on the current conditions (temperature, pH, Aw, etc) but also on the history, or physiological state, of the cells (See Figure 1). Cells that have come from a different environment or are damaged (for example after heat treatment or freezing) may require more time to synthesise macromolecules and repair damage before they can divide than undamaged cells coming from a similar environment.
The lag time is modelled through a dimensionless number between 0 and 1 (‘phys state’), which expresses this physiological state. If phys. state=0, then there is no growth, and the lag time is infinite; if phys. state= 1, there is no lag, and growth will commence immediately. This parameter can be set by the user.
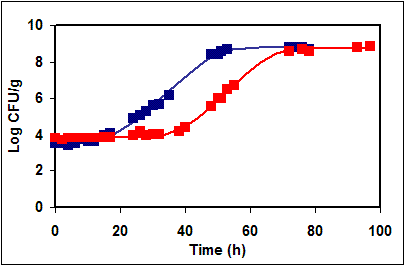
Figure 1. The number of cells present at a given time will depend not only on the maximum specific growth rate but also on the lag time which is history-dependent. These growth curves are from replicate experiments, except that the inocula were prepared differently and led to different physiological states of the primary culture. The maximum specific growth rates are the same while the lag periods, which depend on the history of the cells, are different.
Q: Which value should I input for the phys. state?
A: Because the user is rarely able to provide its value, a typical value is used as default. This means that when the input box is left empty a history, typical for the experiments used to provide the basis of the model, is assumed for the cells.
The user might experimentally evaluate the phys. state value suitable for the pre-incubation conditions of interest. This can be done by fitting growth curves obtained after incubatory conditions simulating the history of the cells (e.g. stress). Once the lag and the growth rate are calculated, the phys. state can be deduced by the equation:
phys. state= 10^(-lag x Max.rate * Ln(10))
It is suggested that users try different values for the physiological state, to study its effect on the growth curve.
Q: On which data are the model predictions based?
A: The ComBase broth models are based on the same data as the previous UK predictive modelling software, Food MicroModel. However, the original models have been improved and contain new features. Note that the models are based on extensive experimental data obtained in liquid culture media under well-controlled laboratory conditions. This is why model predictions are usually ‘fail-safe’ compared with observations in food and there can be no guarantee that predicted values will match those that would occur in any specific food system.
A similar predictive package, Pathogen Modeling Program, based on data generated under the funding of the Agricultural Research Service of the USDA, can be found online on https://pmp.errc.ars.usda.gov/PMPOnline.aspx
Q: I get different maximum rates for the same values of temperature, pH and water activity in the ComBase database and in the ComBase broth models. Why?
A: The predicted rates are from models of kinetics in laboratory media whereas some measurements recorded in the ComBase database are in food. In addition, the models are fail safe, in that they usually predict faster growth rate or slower death rate than observed.
Q: How can I take water activity into consideration when running a model?
A: There is a button on input forms to switch between water activity and NaCl as input values. This option is available for all the models except for the Perfringens Predictor, where only NaCl values are allowed.
Q: Is it possible to download the graphs and print the prediction results?
A: If you print the screen from the Explorer directly, the result is not very well scaled. However, there is a print icon on the on the top right corner of the screen that generates a html page which is more suitable. Users can print this either as pdf or on a paper printer. From this page it is also possible to save the graph as an image by right clicking on it.
Q: What is Perfringens Predictor?
A. Perfringens Predictor is a user-friendly computer-based tool developed to enable prediction, through simulation, of the response of C. perfringens during varied cooling processes for foods which have been heat treated. Perfringens Predictor has been tested by ten potential users (e.g. Environmental Health Officers, food microbiologists from industry, appropriate international experts).
Q: On which data are the model predictions based?
A.The model is based on growth curves and growth rates selected from the ComBase database (combase.errc.ars.usda.gov). Additional curves were also obtained at the Institute of Food Research. Altogether 84 growth rates were used to develop the model. Curves selected were obtained in meat or in culture medium at static temperatures (temperature ranging from to 15 to 52°C, for water activity values between 0.977 and 1, for sodium nitrite concentration ranging from 0 to 150 ppm and for pH values ranging from 5.2 to 8.0.
Q: Has Perfringens Predictor been validated?
A. Perfringens Predictor has been validated for use with different meat types and has also valited experimentally under fluctuating temperatures typical of those encountered during the cooling of meats and with different initial spore concentrations, pH, salt concentration, meats, heating regimes and cooling regimes. Examples of the observed kinetics of C. perfringens during meat cooling and prediction obtained by Perfringens Predictor are made available in the appendix  of the user manual . However, note that use of such predictions is not a substitute for exhaustive testing of a final product formulation before release.
Q: Is it possible to download the graphs and print the prediction results?
A: If you print the screen from the Explorer directly, the result is not very well scaled. However, there is a print icon on the on the top right corner of the screen that generates a html page which is more suitable. Users can print this either as pdf or on a paper printer. From this page it is also possible to save the graph as an image by right clicking on it.
For further information, read the complete user manual