WHAT IS PERFRINGENS PREDICTOR?
Perfringens Predictor is a user friendly tool developed to enable accurate prediction, through simulation, of the response of C. perfringens during the cooling process, for bulked cooked meats. In this edition of Perfringens Predictor the user can input the pH of the meat and the concentration of salt. Moreover, predictions can be performed either for cured or uncured products.
Both graphical and numerical presentation of the simulated response and the cooling data are provided. Graphs, and data for the simulation profile and cooling curves (in X, Y series), can easily be exported to other programs for the purpose of e.g report writing or comparison.
WHY PERFRINGENS PREDICTOR MIGHT BE USEFUL TO ME?
Clostridium perfringens is an important cause of foodborne illness. It is commonly found in many foods including meat and poultry and is associated with food poisoning when cooked foods are subject to inadequate cooling. Slow cooling may allow germination of spores that have survived cooking processes, leading to rapid multiplication of the organism to an infectious dose. Once consumed, sporulation and production of the enterotoxin and associated illness can occur. Accurate predictions of the response of C. perfringens during cooling processes will enable emproved risk assessment and therefore an associated reduction in the extent of foodborne illness related to this organism. Perfringens Predictor provides such a predictive capability.
For further information, read the complete user manual 
This program is intended for prediction of growth of C. perfringens during the cooling of meats that have been heat treated at 70°C-95°C. The meat must be cooled to 15°C or less for a prediction to be given.
1.- INPUTTING COOLING TEMPERATURE PROFILES
Predictions of the concentration are made from data representing the fluctuating time vs. temperature profile expected or measured during cooling of bulked meat. Temperatures should be those in the centre (warmest) part of the meat. The time vs. temperature profile data should be formatted in x,y columns of time, temperature respectively. The profile can be typed directly or copied from another application (e.g. Excel spreadsheet, text file) and pasted.
Please note that the time unit is hours, and the temperature unit is degree centigrade (°C). The initial time must be zero hours, and the temperatures values must be between 0°C and 95°C. A minimum of five time/temperature points are required.
2.- GENERATING A PREDICTION AND INTERPRETING THE RESULTS
Once the temperature profile has been entered, you must input the pH value, the salt concentration and indicate if the meat is cured or uncured. The cured meat option should only be used provided the initial concentration of sodium nitrite is 100 ppm or higher and the residual sodium nitrite concentration is 10 ppm or greater.
The time vs. temperature profile and the predicted response to the selected cooling condition will be displayed. The temperature scale appears on the right hand Y-axis. The left hand Y-axis indicates the scale for predicted increase in concentration of C. perfringens , and appears as a solid line on the plot. A horizontal line is now also present indicating a predicted one log10 increase in concentration of C. perfringens. Perfringens Predictor has been validated for use with different meat types.
3.- MODELLING BACKGROUND
Perfringens Predictor predictions are based on a model developed and validated at the Institute of Food Research. The purpose of this model is to predict the lag phase and growth response of C. perfringens in meat during cooling. Perfringens Predictor uses the Baranyi model (Baranyi and Roberts, 1994). Because of the dynamic background of this model, predictions can be generated for fluctuating temperature profiles. In Perfringens Predictor, the dynamic model is solved numerically, by the fourth order Runge Kutta method.
To solve the Baranyi model in fluctuating temperature, the temperature dependence of the maximum specific growth rate must be modelled. Development of the growth rate model was carried out into two stages. 84 growth curves or growth rates were selected from the ComBase database or obtained at the Institute of Food Research. Curves selected were obtained in meat or in culture medium at static temperatures (temperature ranging from to 15 to 52°C, for water activity values between 0.977 and 1, for nitrite concentrations between 0 and 150 ppm and for pH values ranging from 5.2 to 8). For each growth curve, the maximum specific growth rate was estimated by fitting the model of Baranyi and Roberts (1994) to the experimental log counts. Secondly, the following equation was fitted to the growth rates of C. perfringens calculated in the first step of the modelling:
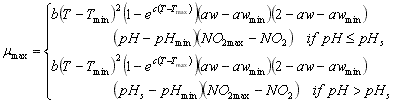
where µmax is the maximum specific growth rate and T, pH, NO2 the temperature, pH and water acitivity respectively. b, c, Tmin (theoretical minimum temperature for growth), Tmax (maximum temperature for growth), pHmin (minimum pH for growth), awmin (minimum aw for growth), NO2max (maximum pH for growth) and pHs (a threshold value above which µmax does not change) are the parameters of the model. The estimated parameters and their standard errors are shown in the table below.
| Parameter |
Estimate |
Standard error |
| b |
0.03901 |
0.00866 |
| Tmin |
12.20 |
0.87 |
| c |
0.0947 |
0.0252 |
| Tmax |
54.47 |
0.52 |
| pHmin |
4.76 |
0.13 |
| pHs |
6.25 |
0.05 |
| awmin |
0.9755 |
0.0006 |
| NO2min |
191 |
15 |
Table 1. Estimated parameters of the growth rate model implemented in Perfringens Predictor.
Germination time and lag time are more difficult to model than the maximum specific growth rate as it depends not only on the current environmental conditions but also on the history (physiological state) of the spores. Spores that are damaged after a heat treatment may require more time to germinate and/or repair damage before growth commences.
The Baranyi model describes the lag time through an a0 value (a dimensionless number between 0 and 1) which is a measure of the physiological sate of the spores. Therefore it is important to determine which a0 values should be used to reflect the physiological state of C. perfringens after typical (industrial process) heating profiles. Experiments carried out at the Institute of Food Research (maximum temperature in the range of 70-95°C) suggest that in cured products an a0 value of 0.001 allows accurate predictions of C. perfringens response during cooling. In uncured products, our experiments suggest that an a0 value of 0.01 should be used for salt concentrations less than 1% and a value of 0.01 for salt concentrations higher than or equal to 1%. These values were implemented in the program.
4.- REFERENCES
Baranyi, J. and Roberts, T.A (1994). A dynamic approach to predicting bacterial growth in food. International Journal of Food Microbiology 23, 277-294.
Ratkowsky, D.A., Lowry, R.K., McMeekin, T.A., Stokes and A.N., Chandler, R.E. (1983). Model for bacterial culture growth rate throughout the entire biokinetic temperature range. Journal of Bacteriology 154, 1222-1226.
For further information, read the complete user manual
1. Format requirements:
The time/ temperature should be inserted in 'changing temperature' table in the format illustrated and described below:
| 0 |
77.5 |
| 2 |
58 |
| 4 |
38.4 |
| 5 |
25 |
| 8 |
13.5 |
| 10 |
12.7 |
| 11 |
8.6 |
For each time temperature record of your cooling profile, time is to be entered first (in hours) then temperature (in °C).
You must use "." as decimal separator.
The profile can be typed directly or copied from another application (e.g. Excel spreadsheet, text file) and pasted into the data table
2.- Model requirements:
Please note that the time unit is hours, and the temperature unit is degree centigrade (°C).
There must be a minimum of 5 and a maximum of 500 points (time vs.temperature) records in your cooling profile.
The temperature values must be between 0 and 95°C.
The records must be recorded in chronological order.
The first time-point must be zero.
The final temperature must be equal or less than 15°C.